Instructions for the RNA protein binding prediction server
Inputing your protein and RNA
Follow the simple steps below this image of the submission page to
obtain your prediction of an RNA protein interaction:
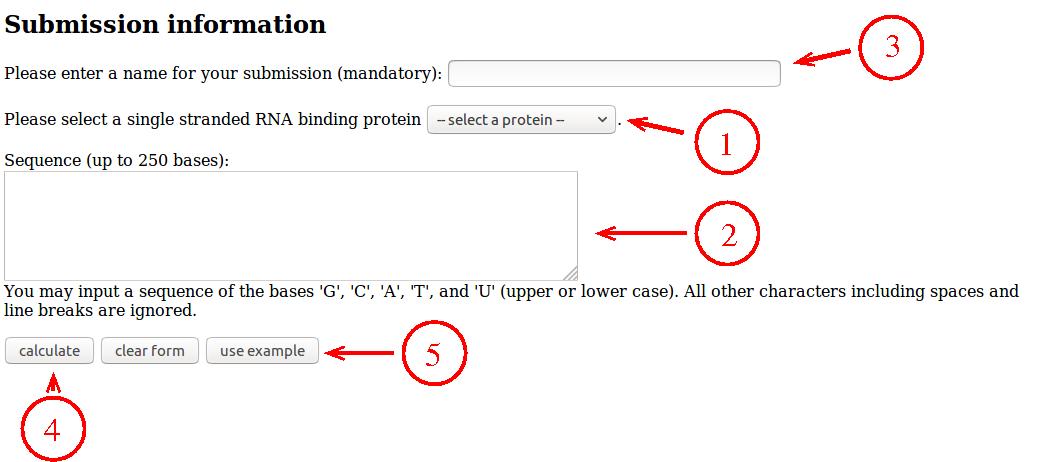
- Choose your protein from the list.
- Enter your RNA sequence using
G, C,
A, and U or T.
- Enter a name for your query (this can be anything that helps you
recognize your query as it will appear
in printouts and file names of your
results).
- Press "calculate".
- If you just want to try out the server, you can press the "use example"
button to fill the form with an example case and then press "calculate".
Interpreting the results of the RNA protein interaction prediction
After submitting your query, your results will be shown on a page that looks
like this:
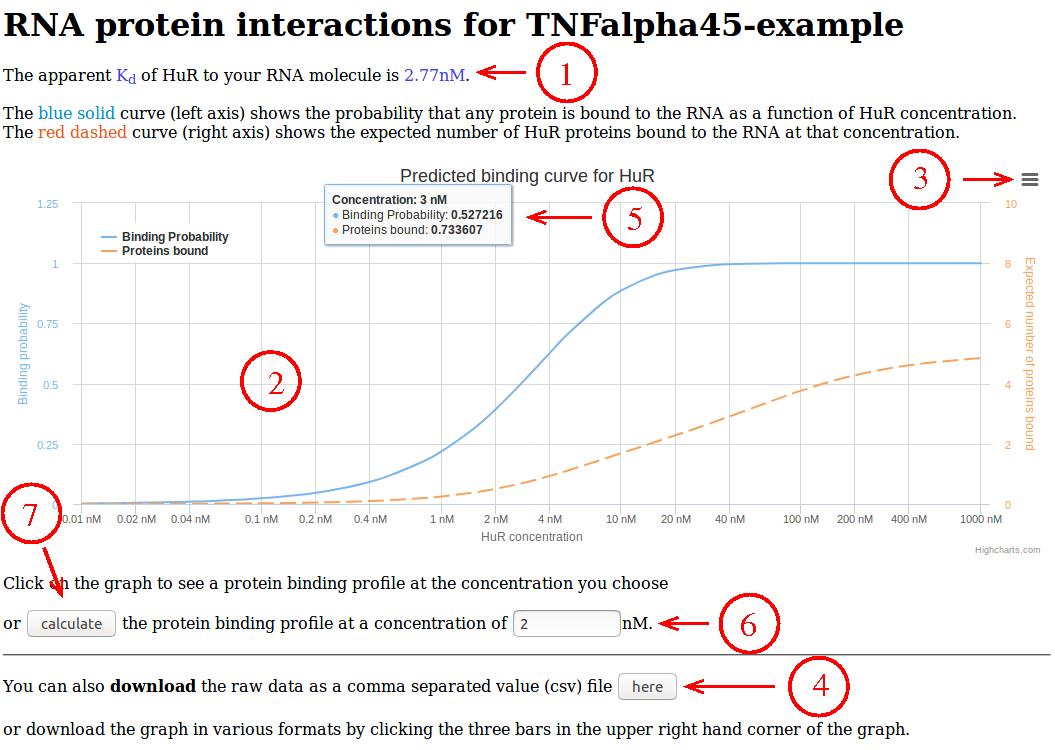
- The binding affinity, i.e., the concentration at which half of the
RNAs are bound by protein, is shown at the top.
- The graph shows the probability for an RNA to be bound by protein
(blue solid line, left axis) and the expected number of proteins bound to
an RNA (red dashed line, right axis) as a function of (free) protein
concentration.
- By clicking on the three bars in the upper right hand corner of the
graph, the graph can be downloaded in various image formats.
- The data underlying the graph can also be downloaded as a comma
separated value (csv) file by clicking this button.
- Underlying values are also shown when hovering the mouse over the
graph.
- In order to obtain protein binding profiles, i.e., information
on where along the RNA molecule proteins are expected to bind at
a given protein concentration, the protein concentration can be
entered here...
- ... followed by pressing the "calculate" button. Alternatively,
one can also just click at the desired concentration in the graph.
Interpreting binding profiles
After selecting a specific protein concentration, the server will show
the following protein binding profiles:
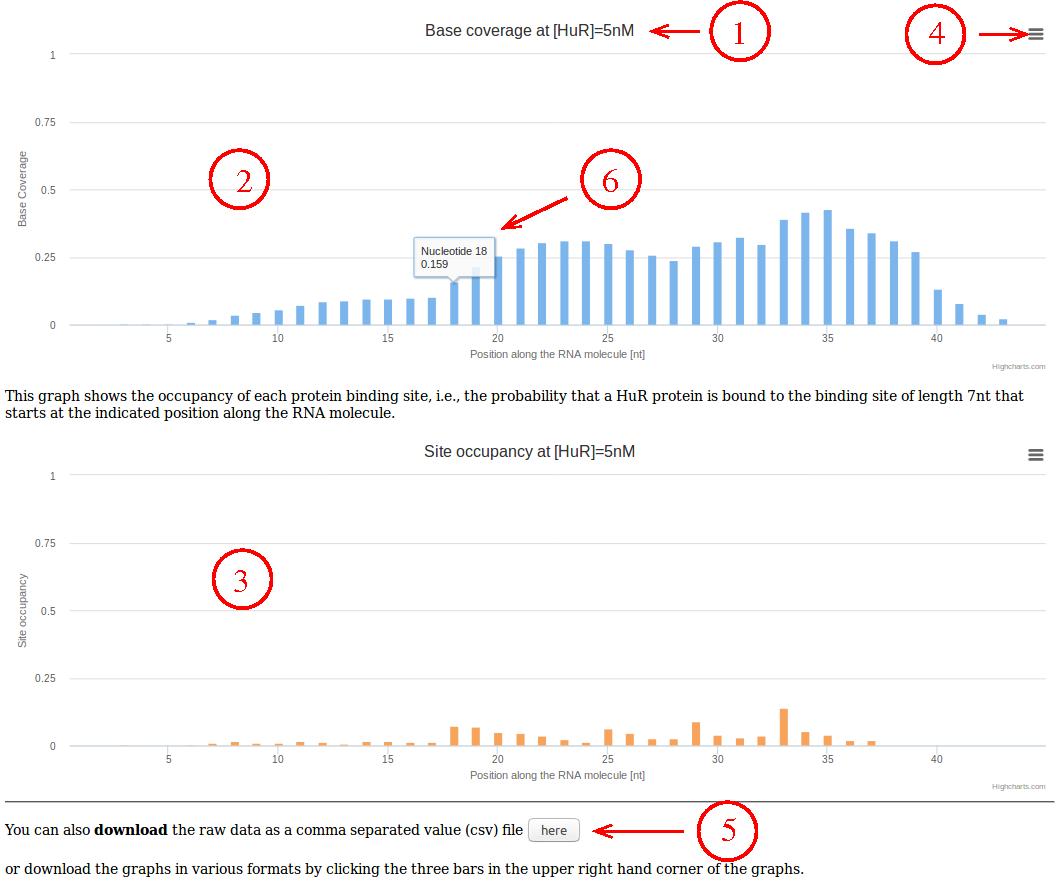
- The selected protein concentration is shown in the titles of the
graphs as well as on top of the page.
- The first (blue) graph shows the probability for each nucleotide
along the RNA to be bound by a protein.
- The second (red) graph shows the probability that a protein footprint
starts at any given nucleotide along the RNA.
- By clicking on the three bars in the upper right hand corner of the
graphs, the graphs can be downloaded in various image formats.
- The data underlying the graph can also be downloaded as a comma
separated value (csv) file by clicking this button.
- Underlying values are also shown when hovering the mouse over the
graph.
If you make use of data generated on this server in your own publications,
please do not forget to cite the manuscript:
Yi-Hsuan Lin, Jeffrey Gaither, and Ralf Bundschuh,
RBPBind: Quantitative prediction of Protein-RNA Interactions
To download the source code underlying this server go here.
For questions and/or comments please send an email to
ASC-bioserv@osu.edu.
This includes suggestions for new proteins to add, ideally
accompanied by a reference for their RNACompete or RNA Bind-n-Seq data and one or
a few references on independently determined absolute binding affinities for specific
RNA molecules.